
Interactive Data Exploration with Python: Getting Started with Trame and VTK
A Beginner's Guide to Interactive 3D Visualization

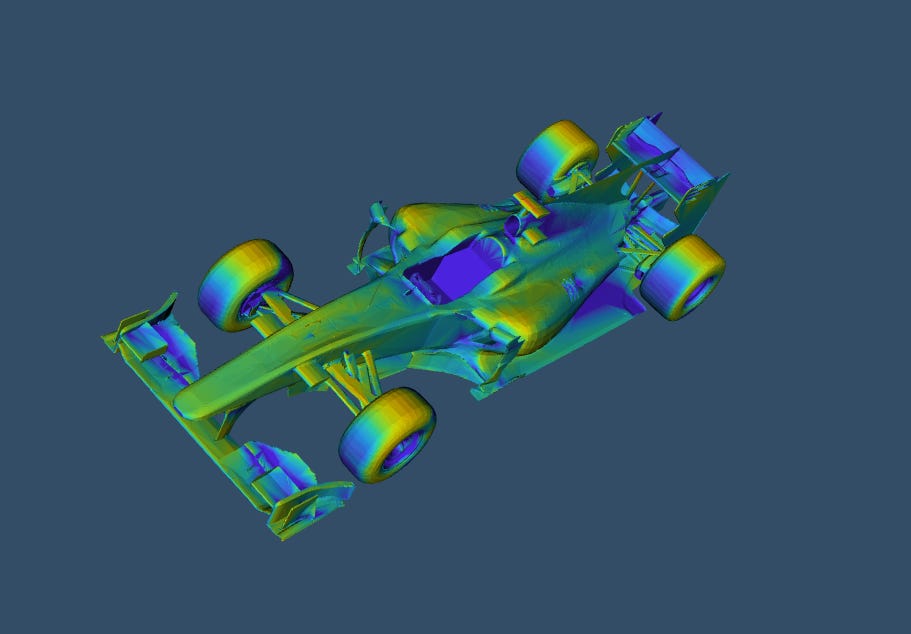
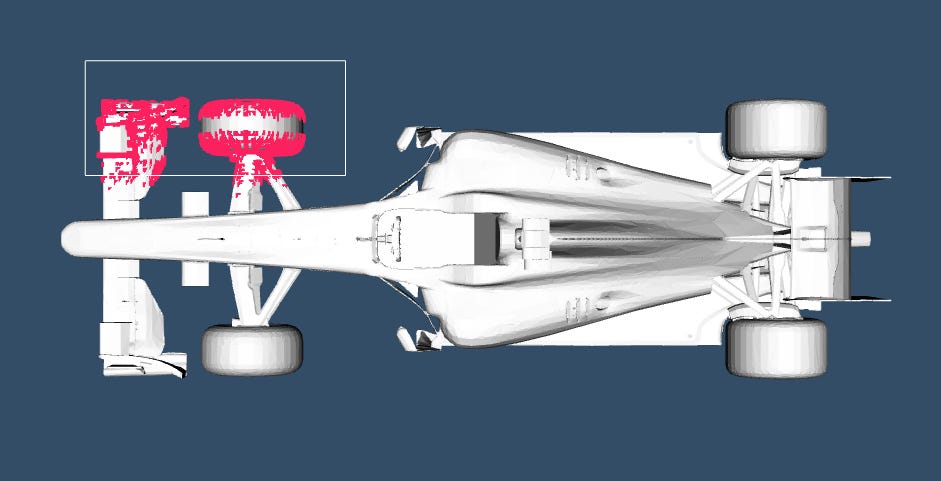
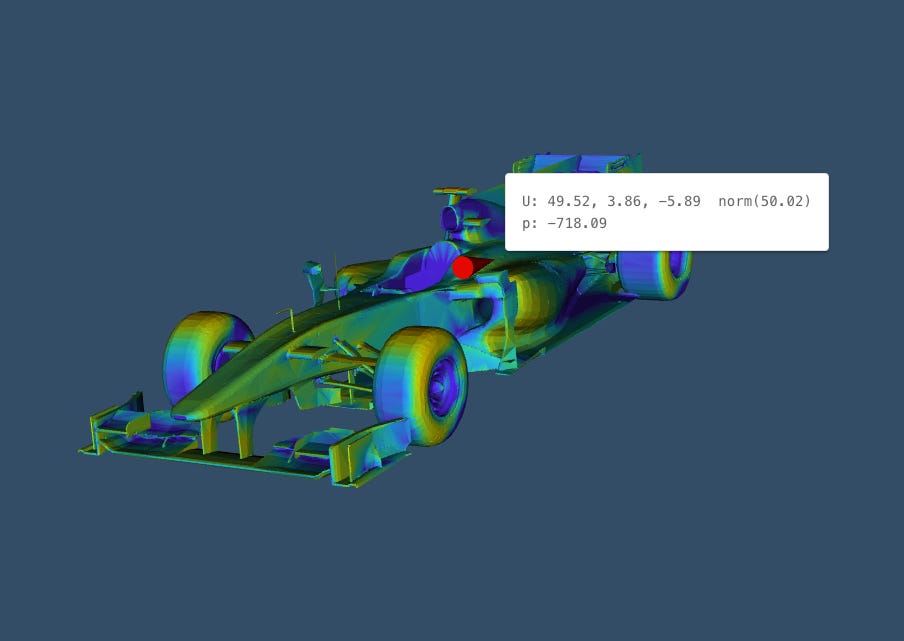
Let’s talk about how Python can help us explore complex 3D data interactively, using Trame and VTK (Visualization Toolkit). This powerful combination lets you navigate a 3D model in real-time, probe for specific data points, and view dynamic color mappings like heatmaps to highlight critical zones. You can adjust filters and parameters to focus on specific areas of interest, making it perfect for hands-on exploration of complex data.
Scientific visualization is a powerful way to turn abstract numbers into something visually tangible. For anyone delving into fields like engineering, physics, or data science, knowing how to represent data in a 3D interactive format opens new possibilities for analysis and interpretation. That’s where Trame, an open-source Python library built by Kitware, and VTK (Visualization Toolkit) come in.
Trame provides a streamlined way to build web applications in Python, enabling scientists and engineers to create complex visualizations without worrying about front-end coding. It uses VTK under the hood for 3D rendering, making it especially powerful for real-time interactions with large datasets. VTK itself is a comprehensive C++ library with Python bindings that has long been favored for rendering complex scientific and engineering data due to its robust functionality and flexibility. While this example app is inspired by an existing example from Trame’s documentation here, our goal is to illustrate how you can use these tools to create custom visualizations that bring your data to life.
This project is a perfect opportunity to explore how Python can elevate your scientific and engineering workflows.
Installation Requirements
Before we dive into the code, make sure to install the necessary libraries:
pip install trame trame-vuetify trame-vtk trame-componentsCode Breakdown
Imports and Server Setup
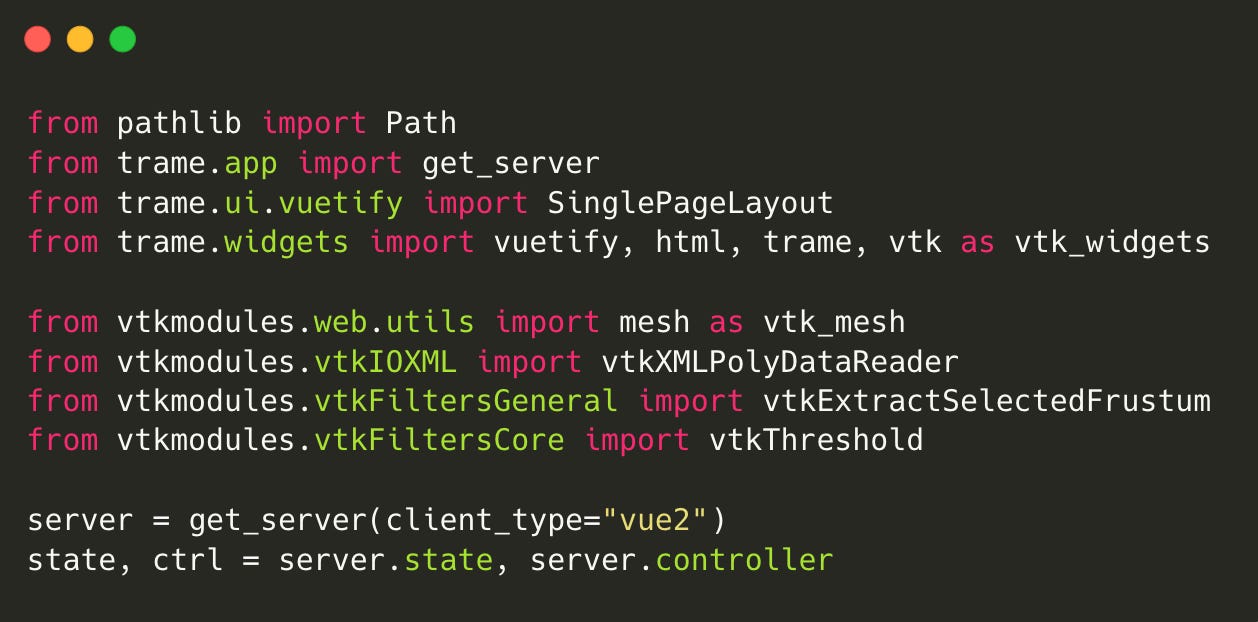
The get_server function initializes the Trame server, setting up the environment for our web application.
Constants and Initial Setup
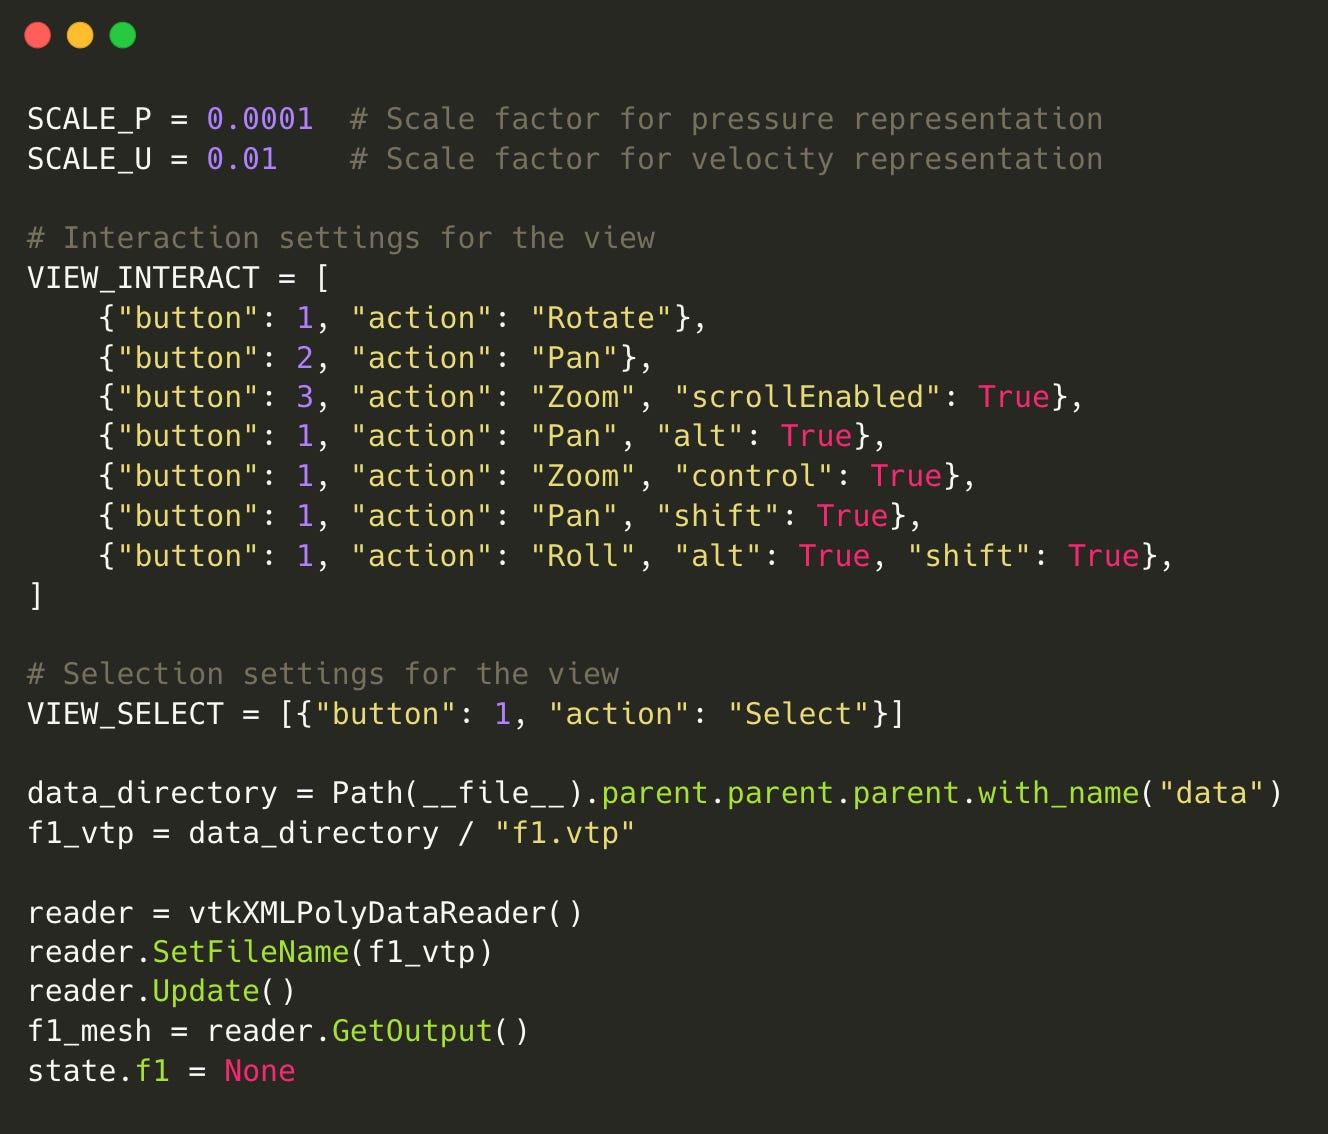
SCALE_P and SCALE_U: These constants are scaling factors used to adjust the representation of pressure and velocity data in the visualization. The values are set to very small numbers to ensure that the visualization appears appropriately scaled on the display.
VIEW_INTERACT: This list defines the various interaction modes available to the user while visualizing the data. It specifies actions for different mouse buttons:
Button 1: Rotate the view.
Button 2: Pan the view.
Button 3: Zoom in/out, with scroll enabled.
Additional combinations of mouse buttons with modifiers (like Alt or Control) to provide further control over the visualization.
VIEW_SELECT: This list specifies the interaction mode for selecting elements in the visualization. It uses Button 1 to trigger selection.
Data Directory: We specify the directory where our data file (
f1.vtp) is located. You can download the file here.VTK Reader: The
vtkXMLPolyDataReaderreads the VTP file, which contains the F1 car's geometry and telemetry data. The resulting mesh is stored inf1_mesh.
Extracting Field Parameters
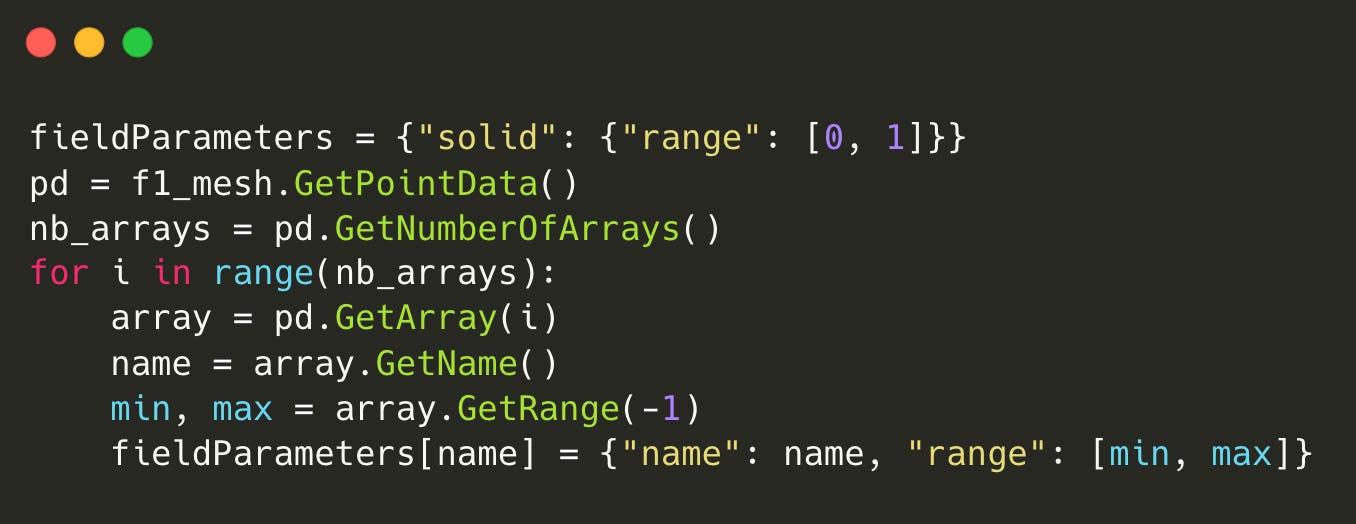
In this section, we extract the field parameters from the point data of the mesh. This includes defining ranges for various telemetry data such as pressure and velocity, which are critical for analyzing performance metrics.
Frustum Extraction and Thresholding
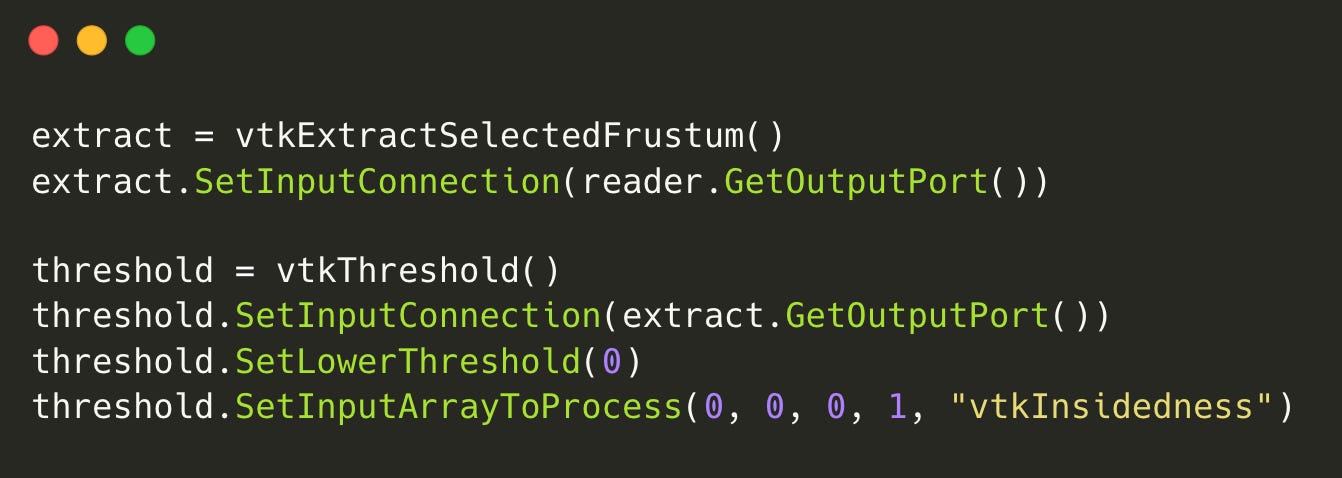
Frustum Extraction: This allows us to focus on a specific region of the 3D space around the car, providing more relevant data during interaction.
Thresholding: This sets a lower threshold for visibility, filtering out elements below this value based on the
vtkInsidednessarray, ensuring we only display relevant data points.
Web App Setup
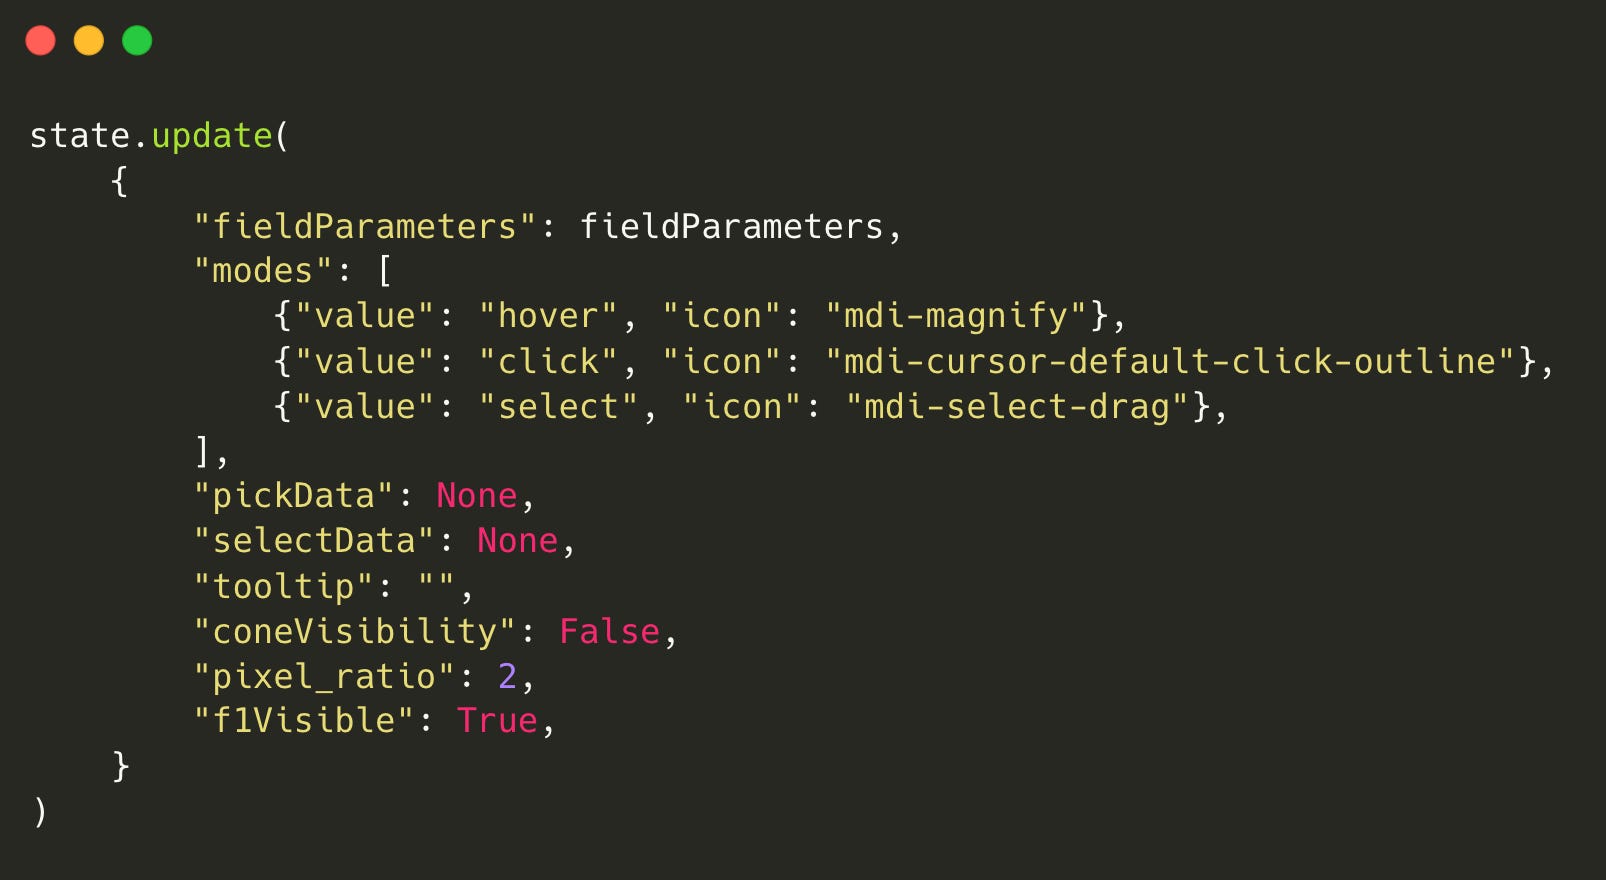
This section configures the state for the web application, including the available picking modes (hover, click, select) and the initial visibility settings for our F1 mesh.
Interactivity: Callbacks
The various @state.change decorators set up callback functions to update the application state based on user interactions, such as selecting a region or hovering over the mesh to display tooltips.
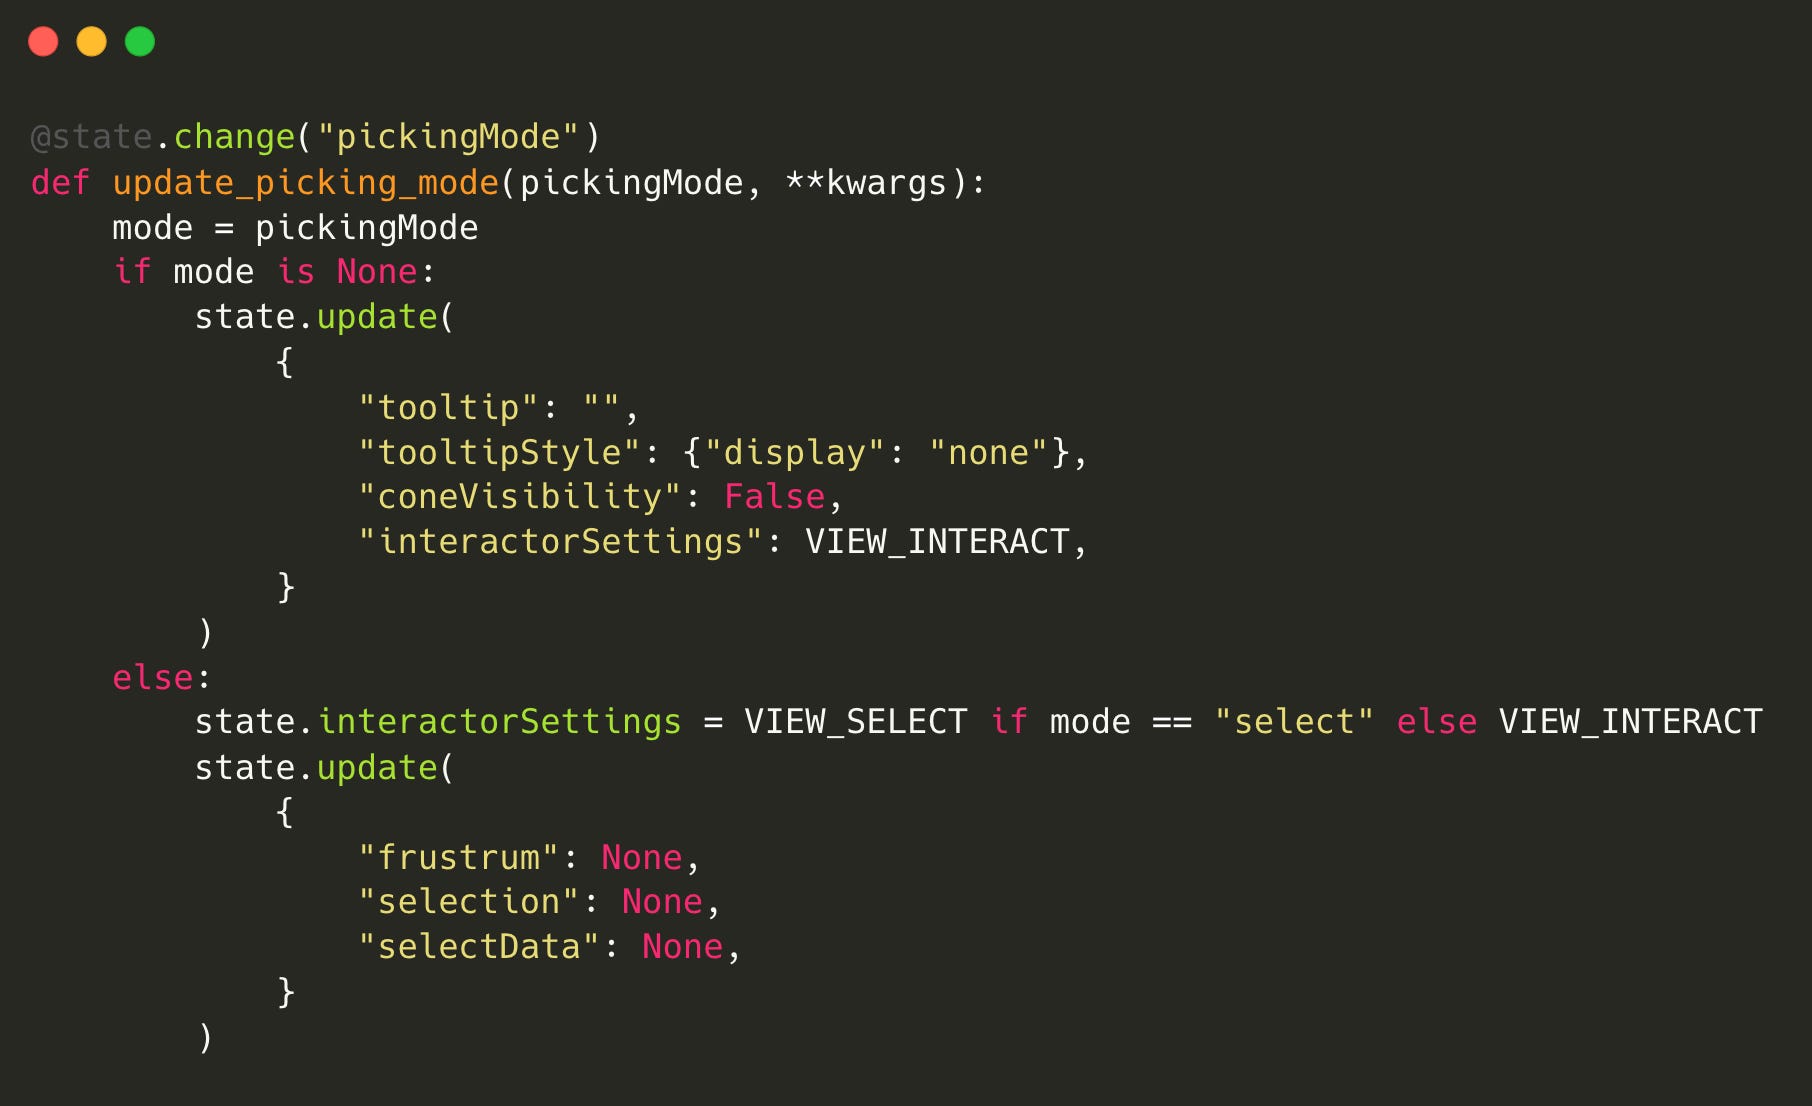
update_picking_mode: This callback triggers when the
pickingModestate changes. IfpickingModeisNone, it hides the tooltip and the cone visualization. If it is set to "select," it switches to selection interaction settings; otherwise, it sets the interaction back to the default.
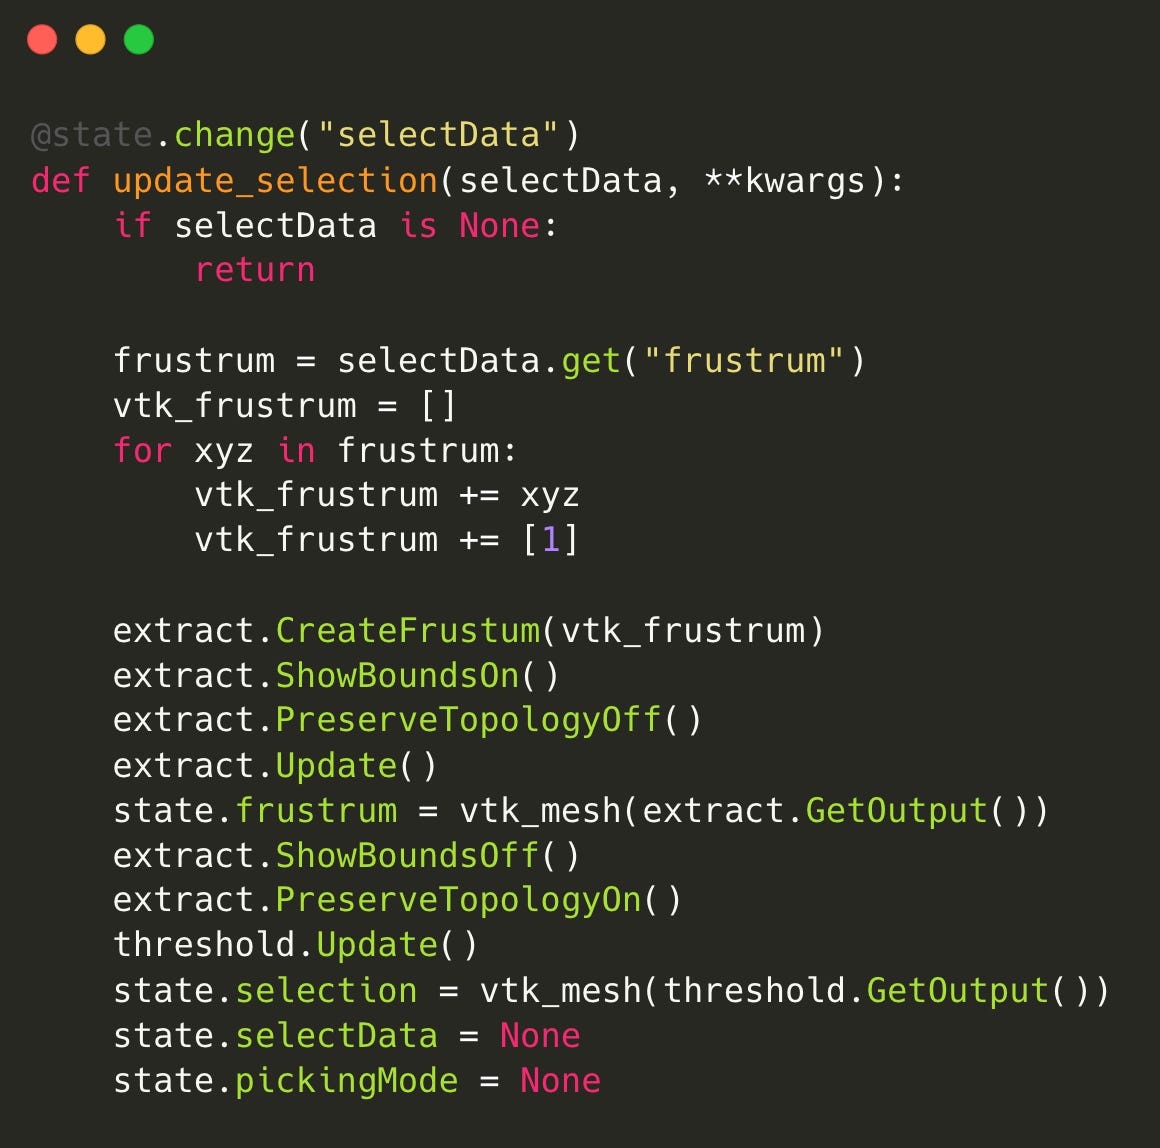
update_selection: This callback executes when
selectDatachanges. IfselectDatais notNone, it retrieves the frustum data and updates the extraction algorithm, creating a selection frustum in the visualization. It updates the state with the selected mesh and resets the selection data.
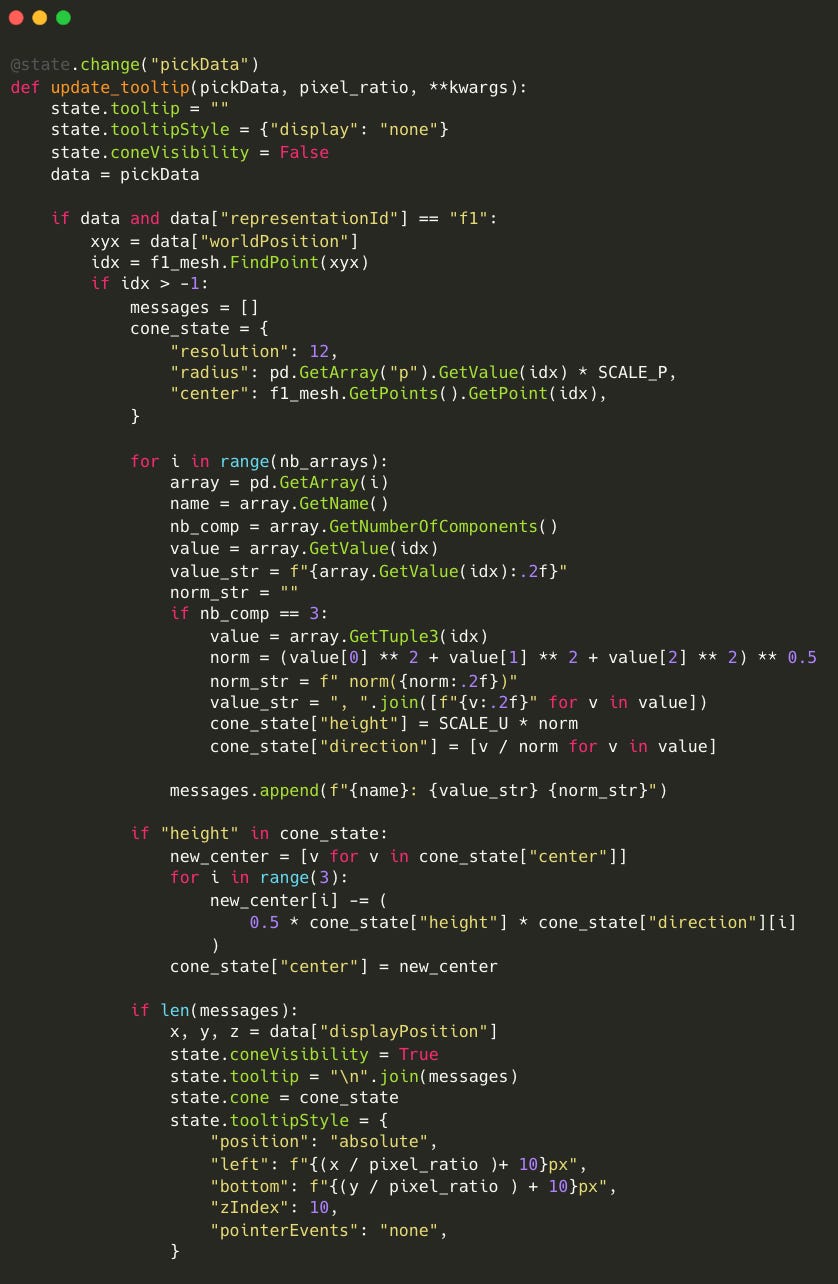
update_tooltip: This callback updates the tooltip displayed to the user when a point on the mesh is picked. It calculates the position and data for the tooltip based on the picked data. If the point is valid, it constructs a cone representation and prepares the tooltip text showing various properties of the selected point.
Rendering the Visualization
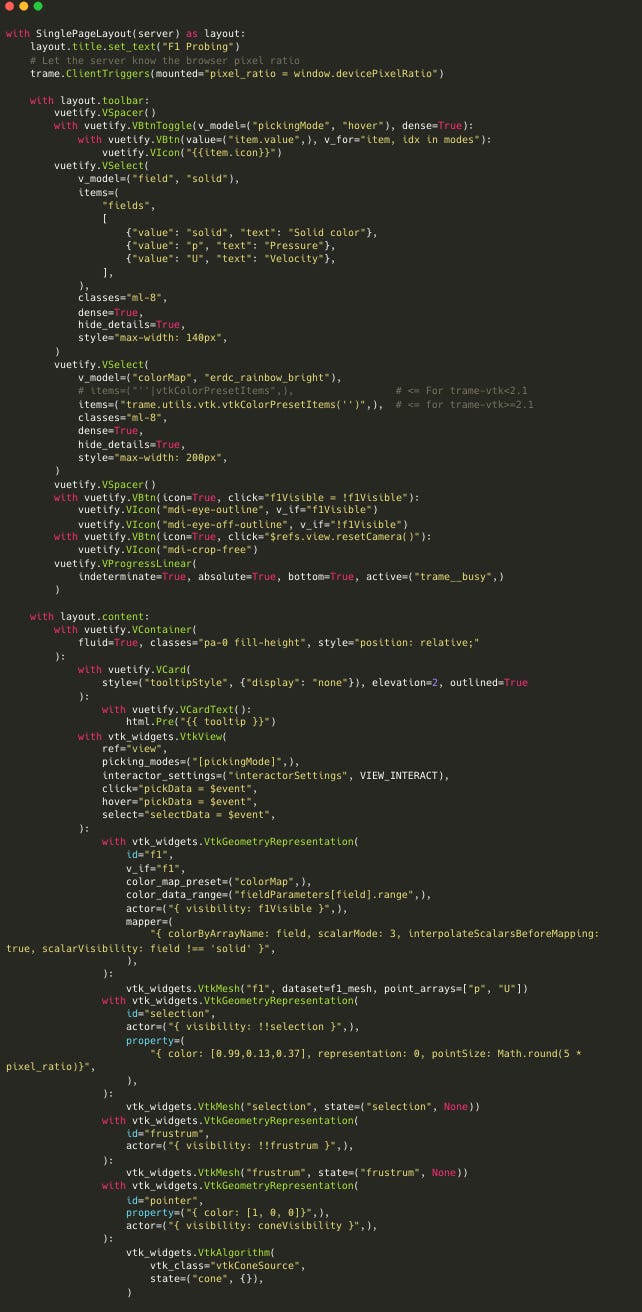
SinglePageLayout: This section creates the layout of the application, including a title and client triggers.
Toolbar: The toolbar allows users to toggle between picking modes and choose data fields to visualize. It contains buttons for visibility toggling and camera resetting, along with progress indicators.
Content Area: The content area contains the main visualization, represented by
VtkViewand associated representations for different components like the F1 mesh, selection mesh, frustum, and pointer.Mesh and Geometry Representations: These sections define how the F1 mesh and selections appear, including colors and visibility based on user interactions.and controls.
Jupyter Notebook Integration
The Jupyter section enables the integration of the Trame application with Jupyter notebooks, allowing for interactive visualizations directly within the notebook
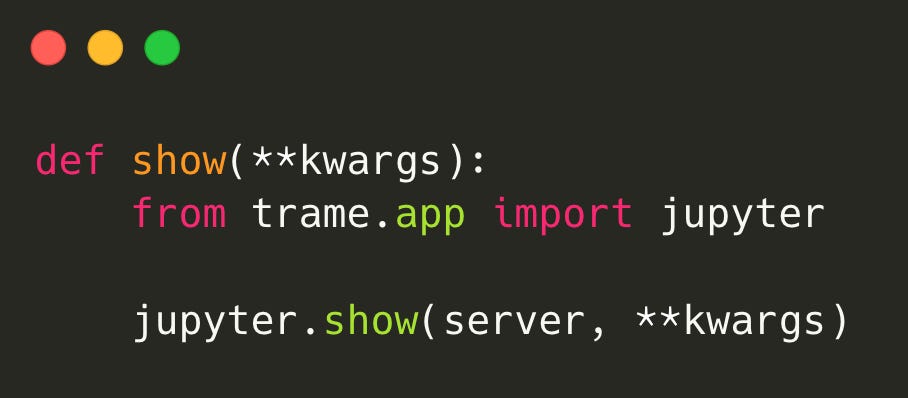
In this section, the show function imports the jupyter module from trame.app and calls its show method with the server instance and any additional keyword arguments. This allows the application to be displayed in a Jupyter notebook cell.
Run the script from CLI
This section enables the script to be run directly from the command line, starting the Trame server.
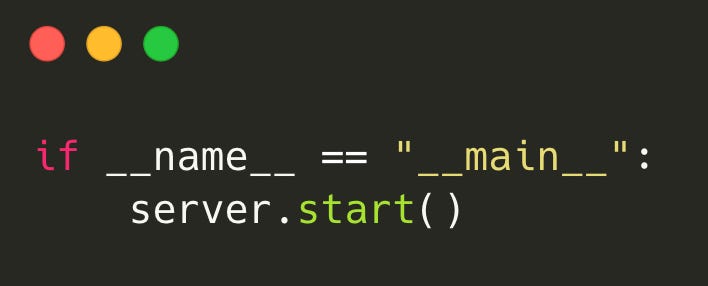
The if __name__ == "__main__": construct ensures that the server.start() method is only called when the script is executed directly, not when it's imported as a module. This starts the Trame application server, allowing users to access the web interface for the visualization.
Conclusion
Utilizing Python with Trame and VTK opens up a world of possibilities for interactive 3D data visualization. This powerful toolkit not only simplifies the process of building web applications but also enhances the ability to analyze and interpret complex datasets dynamically. The ability to interact with 3D models in real-time, customize visual representations, and filter data effectively equips users with a robust platform for deep analysis.
Python’s rich ecosystem offers a diverse range of libraries that cater to various needs. In upcoming topics, we will dive into more Python libraries that can further enhance our projects, such as Matplotlib for 2D plotting, Pandas for data manipulation, and TensorFlow for machine learning.